2. Categories and zones#
Learn about Trove’s top-level categories. What’s in them and why?
Trove’s resources are divided into categories. Understanding the nature and content of these categories will help you construct effective searches and access useful data.
There are ten categories in Trove:
Books & Libraries
Diaries, Letters & Archives
Images, Maps & Artefacts
Lists
Magazines & Newsletters
Music, Audio & Video
Newspapers & Gazettes
People & Organisations
Research & Reports
Websites
On the surface they seem to based on the format of resources – books in one category, newspapers in another. But it’s a bit more complicated than that. Categories are determined by the format of a resource, the source of data about the resource, and the way that data is managed within Trove. For example, newspaper articles are obviously in the Newspapers category, but part of the reason is that newspaper articles are added, described, and managed within their own separate system.
The mysterious case of the Australian Women’s Weekly
Ever wondered why the Australian Women’s Weekly is found in the Newspapers category and not with the Magazines? It’s because when the Women’s Weekly was digitised, the only way for Trove to ingest digitised publications was through the newspapers pipeline. Comparable systems for managing magazines, journals, books, images, and other digitised content came later.
2.1. All categories are not the same#
Broadly speaking, there are two types of categories in Trove: those that aggregate content, in various formats, from range of organisations and sources; and those that are limited to a specific type of resource created or managed by the NLA.
Categories that contain aggregated content in a variety of formats:
Books & Libraries
Diaries, Letters & Archives
Images, Maps & Artefacts
Music, Audio & Video
Research & Reports
Categories limited to a specific type of resource:
Lists – created by Trove users
Magazines & Newsletters – digitised periodical articles
Newspapers & Gazettes – digitised newspapers
People & Organisations – identity records
Websites – archived copies of born-digital resources
Trove being Trove, this distinction is not always clear cut. While newspapers and periodical articles have their own dedicated categories, the rest of the NLA’s digitised content (books, maps, photographs etc) are lumped into the general resource pool. The Magazines & Newsletters category almost exclusively contains articles from periodicals digitised by the NLA, but if you search for NOT "nla.obj" you’ll find a small amount of content from other sources – mostly issues of the Tattersall’s Club Magazine. And while the ‘People & Organisations’ category only contains identity records minted by the NLA, these records aggregate and disambiguate data from a number of other sources. Nonetheless, the distinction mostly holds, and it’s useful to keep in mind when you start exploring how categories actually work in Trove.
2.2. Contexts not collections#
The categories that contain a specific type of resource, such as Newspapers & Gazettes, are relatively easy to understand – they operate as distinct collections with clear boundaries. But the categories that contain aggregated content are more complicated, and sometimes confusing.
The first thing to note is that individual resources can appear in more than one of these categories. For example, if you search for “Tasmanian Mineral Chart Series” you’ll be presented with the same set of results in both the Research & Reports and Images, Maps & Artefacts categories. Why does this happen? The clue is in the formats of the matched resources – all of them are described both as Map and Government publication. Unsuprisingly, resources with the format Map end up in the Images, Maps & Artefacts category. But those described as Government publication are routed to Research & Reports. Rather than choosing between competing categories, Trove adds them to both.
Similarly, a search for the book Atlas of Australia with all the gold regions returns five results in Books & Libraries, with three of those results duplicated in Images, Maps & Artefacts. All of them have the format Book, but the three in Images, Maps & Artefacts also have the format Map.
There are many examples where resources have multiple, competing formats:
3,000 resources are both
Book(Books & Libraries) andArt work(Images, Maps & Artefacts)22,000 resources are
Government publication(Research & Reports) andVideo(Music, Audio & Video)1,000 resources are
Object(Images, Maps & Artefacts) andUnpublished(Diaries, Letters & Archives)
There are also some formats, such as Audio book, which are associated with multiple categories. These overlaps become even more complex when mixed with Trove’s grouping of works and versions. Individual works can combine multiple versions in different formats.
By duplicating results across categories, Trove is trying to make these resources easier to find, and that’s good! The problem really is with the idea of ‘categories’. Until 2020, Trove’s categories were called ‘zones’, but during the initial design process they were referred to as ‘collection views’.[Cathro and Collier, 2010] The ‘collection view’ label provides a much clearer indication of the purpose of these top-level groupings – they’re not collections, they’re contexts for discovery.
They key point is that aggregated resources don’t really belong to a category. You might have noticed that individual work records in both the web interface and the API, don’t tell you the category (or categories) that work belongs to. If you have a work record, the only way to find its associated categories is to run a search for it. Categories only make sense when you’re searching. They’re not buckets of content, they’re windows onto a big pool of aggregated resources.
2.3. What ends up where?#
But how do formats get associated with categories? The following table is included in the Trove Data Dictionary to help contributors prepare their metadata for ingest. Trove inspects the contents of the type field in contributed records to determine their destination. Books & Libraries is the default category for records with missing or unexpected type values. So a record with cartoon in its type field will end up in the Images, Maps & Artefacts category.
Category |
Type |
|---|---|
Books & Libraries |
archived website, audio book, book, braille, dissertation, doctorate, ebook, illustrat*, large print, monograph, musical score, talking book, thesis |
Diaries, Letters & Archives |
archiv*, business record, correspondence, financial record, letter, manuscript, personal papers, scrapbook |
Research & Reports |
data set, dataset, thesis, theses |
Music, Audio & Video |
audio, audio book, broadcast, broadcast transcript, lecture, interview, motion picture, moving image, music, oral, radio score, sheet music, sound, speaking, story, talking book, video |
Images, Maps & Artefacts |
cartoon, chart, diagram, drawing, engraving, etching, flash card, graph, image, ink, lithograph, object, original art work, painting, pencil, photograph, postcard, poster, sketch, still image, table, watercolo* , aerial photograph, atlas, globe |
You can see that there overlaps between categories. For example, ‘audio book’ is associated with both Books & Libraries and Music, Audio & Video. Also formats like ‘article’ and ‘report’ are missing completely – I think both of these are associated with Research & Reports.
Confused about types and formats?
Beware that type and format can have different meanings depending on where you are in Trove! In the web interface, the facet headed ‘Type’ is used to distinguish between ‘sub categories’ such as newspaper and gazette, while ‘Format’ describes the resource’s format. In the API, the format values are in the type field, although you use them with the format facet! There can also be a separate format field in work and version records that contains a physical description.
2.4. From zones to categories#
Trove originally delivered resources through ‘zones’ rather than ‘categories’. Trove’s 2020 update introduced ‘categories’ and redistributed content across them. However, this change only applied to the web interface – the API continued to use zones until the introduction of API version 3 in 2023.
The change from `zones’ to ‘categories’ was not simply a matter of switching labels as the diagram below illustrates.
The most significant change was the break-up of the old Journals, articles and data sets zone. Its content has been split between Books & Libraries and the two new categories Magazines & Newsletters and Research & Reports.
2.5. Number of resources in each category#
We can use the Trove API to access data about most categories. For example, here’s the total number of resources per category.
Show code cell source
import pandas as pd
import requests

headers = {"X-API-KEY": YOUR_API_KEY}
params = {
    "category": "all",  # By setting category to all, we get data from all categories
    "n": 0,
    "encoding": "json",
}

response = requests.get(
    "https://api.trove.nla.gov.au/v3/result", params=params, headers=headers
)
data = response.json()

# Get name and total results from each category
categories = [
    {"category": c["name"], "total": c["records"]["total"]} for c in data["category"]
]

# Convert to a Pandas DataFrame
df_cats = pd.DataFrame(categories)

# Display as a table
df_cats.style.format(thousands=",").hide()
| category | total |
|---|---|
| Books & Libraries | 27,918,511 |
| Diaries, Letters & Archives | 5,604,193 |
| Images, Maps & Artefacts | 6,306,855 |
| Lists | 113,760 |
| Magazines & Newsletters | 1,835,653 |
| Music, Audio & Video | 3,427,291 |
| Newspapers & Gazettes | 253,611,449 |
| People & Organisations | 1,332,175 |
| Research & Reports | 5,880,095 |
Show code cell source
import altair as alt

chart_category_totals = (
    alt.Chart(df_cats)
    .mark_bar()
    .encode(
        x=alt.X("total:Q", axis=alt.Axis(format=",d")),
        y="category:N",
        color=alt.Color("category:N", legend=None),
        tooltip=["category:N", alt.Tooltip("total:Q", format=",d")],
    )
    .properties(width="container", height=300)
)

chart_category_totals
Fig. 2.1 Number of resources in each Trove category#
Some caution is needed when interpreting these figures. As noted above, there are overlaps between categories so some resources will be counted twice. On the other hand, there’ll be resources that are not individually counted because they’ve been wrongly grouped into a ‘work’. The numbers are useful for comparison and in observing trends over time, but they don’t accurately represent the number of unique resources described in Trove.
There’s no data about archived websites available through the main API so it doesn’t appear in this chart. If it did, it would dramatically reshape the results as it contains billions of website captures.
If you’re interested in how these totals change over time, the trove-zone-totals repository harvests and saves the data every week.
2.6. Distribution of formats across categories#
As noted above, categories are linked to particular formats. To explore these links further, you can use the format facet to see which types of resources are grouped within each category. Currently there are 46 different format values used within Trove. Here’s the number of different formats in each category according to the format facet.
Show code cell source
import pandas as pd
import requests


def get_children(term):
    facets = []
    for child_term in term["term"]:
        facets += get_term(child_term)
    return facets


def get_term(term):
    facets = []
    facets.append({"format": term["search"], "total": int(term["count"])})
    if "term" in term:
        facets += get_children(term)
    return facets


def get_formats(category):
    facets = []
    try:
        for term in category["facets"]["facet"][0]["term"]:
            facets += get_term(term)
    except (KeyError, TypeError):
        return []
    formats = [
        dict(
            f, **{"category_name": category["name"], "category_code": category["code"]}
        )
        for f in facets
    ]
    return formats


headers = {"X-API-KEY": YOUR_API_KEY}

params = {
    "q": " ",
    "category": "all",
    "encoding": "json",
    "n": 0,
    "key": YOUR_API_KEY,
    "facet": "format",
}

formats = []
response = requests.get(
    "https://api.trove.nla.gov.au/v3/result", params=params, headers=headers
)
data = response.json()
for category in data["category"]:
    formats += get_formats(category)

df_formats = pd.DataFrame(formats)

df_formats.loc[df_formats["total"] > 0].groupby("category_name")[
    "format"
].nunique().to_frame().reset_index()
| category_name | format | |
|---|---|---|
| 0 | Books & Libraries | 23 |
| 1 | Diaries, Letters & Archives | 3 |
| 2 | Images, Maps & Artefacts | 15 |
| 3 | Lists | 1 |
| 4 | Magazines & Newsletters | 10 |
| 5 | Music, Audio & Video | 10 |
| 6 | Newspapers & Gazettes | 1 |
| 7 | Research & Reports | 21 |
Once again Websites are missing as there’s no API data available. People & Organisations are also missing from this chart, as identity records have no format. Of the categories that remain, Lists and Newspapers & Gazettes contain a single record format. The other categories have a mix of formats. This generally reflects the division, noted above, between categories that contain aggregated content, and those that are limited to a specific type of resource managed by the NLA.
However, there’s a problem with this data. Here’s a list of formats associated with Images, Maps & Artefacts. What’s missing?
Show code cell source
df_formats.loc[df_formats["category_code"] == "image"][
    ["format", "total"]
].style.format(thousands=",").hide()
| format | total |
|---|---|
| Photograph | 4,892,660 |
| Object | 598,762 |
| Map | 401,926 |
| Map/Aerial photograph | 12,321 |
| Map/Atlas | 37,744 |
| Map/Braille | 134 |
| Map/Electronic | 6,600 |
| Map/Globe or object | 585 |
| Map/Large print | 53 |
| Map/Map series | 16,178 |
| Map/Single map | 259,959 |
| Poster, chart, other | 264,923 |
| Art work | 263,618 |
| Government publication | 187,919 |
| Microform | 17,940 |
As noted above, there are significant overlaps between categories, including 3,000 resources that are described as both books and artworks. So why are no books showing up in Images, Maps, & Artefacts? It turns out that some facet values are hidden, both in the web interface and the API. You can test this for yourself. This blank search in Images, Maps, & Artefacts doesn’t include Book in the list of formats.
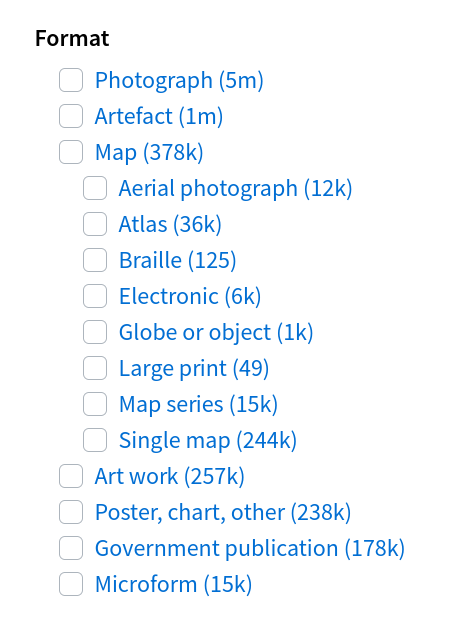
Fig. 2.2 Default list of formats in Images, Maps, & Artefacts category#
But if you add &l-format=Book to the url, 51,000 books magically appear!
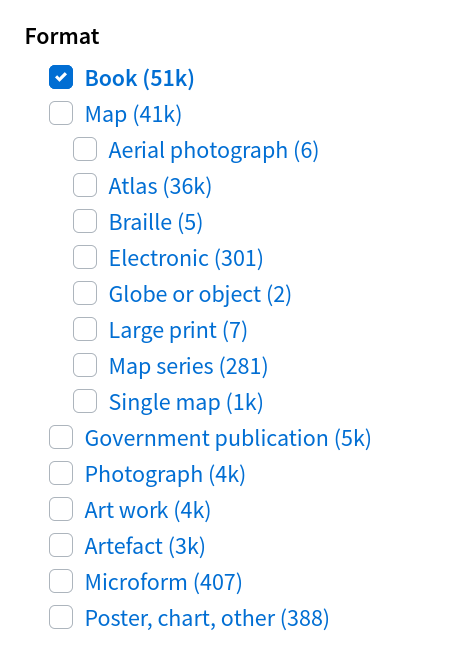
Fig. 2.3 List of formats in Images, Maps, & Artefacts category when l-format=Book is applied#
I suspect this has been done to simplify the web interface and avoid confusion – it presents a somewhat idealised version of categories, where the grouping of formats aligns with user expectations. But the fact that this carries over to the API results means that format facet can’t be relied upon in an analysis of the contents of categories.
The workaround is run a separate search for each format value and compile the results. The number of formats in each category changes significantly.
Show code cell source
import pandas as pd
import requests

df_harvested_formats = pd.read_csv(
    "https://raw.githubusercontent.com/wragge/trove-zone-totals/main/data/trove-category-formats.csv"
)
formats = list(df_harvested_formats["format"].unique())

headers = {"X-API-KEY": YOUR_API_KEY}

params = {
    "category": "all",
    "encoding": "json",
    "n": 1,  # If you set n=0 here you get a 500 error
    "key": YOUR_API_KEY,
}

format_counts = []

for format in formats:
    params["l-format"] = format
    response = requests.get(
        "https://api.trove.nla.gov.au/v3/result", params=params, headers=headers
    )
    data = response.json()
    for cat in data["category"]:
        format_counts.append(
            {
                "category_name": cat["name"],
                "category_code": cat["code"],
                "format": format,
                "total": cat["records"]["total"],
            }
        )

df_all_formats = pd.DataFrame(format_counts)

df_all_formats.loc[df_all_formats["total"] > 0].groupby("category_name")[
    "format"
].nunique().to_frame().reset_index()
| category_name | format | |
|---|---|---|
| 0 | Books & Libraries | 45 |
| 1 | Diaries, Letters & Archives | 39 |
| 2 | Images, Maps & Artefacts | 45 |
| 3 | Lists | 1 |
| 4 | Magazines & Newsletters | 21 |
| 5 | Music, Audio & Video | 43 |
| 6 | Newspapers & Gazettes | 1 |
| 7 | Research & Reports | 45 |
With the blinkers removed, you can see that most categories contain most formats. Indeed, Books & Libraries, Images, Maps & Artefacts, and Research & Reports contain a mix of every format (excluding List).
One surprise is that Magazines & Newsletters contains 20 different formats even though it almost exclusively contains periodical articles digitised by the NLA and partners.
Show code cell source
df_all_formats.loc[
    (df_all_formats["total"] > 0) & (df_all_formats["category_code"] == "magazine")
][["format", "total"]].style.hide()
| format | total |
|---|---|
| Book | 922 |
| Book/Braille | 1 |
| Book/Illustrated | 112 |
| Article | 1834941 |
| Article/Book chapter | 4 |
| Article/Conference paper | 2 |
| Article/Journal or magazine article | 1832566 |
| Article/Other article | 2374 |
| Article/Report | 87 |
| Periodical | 711 |
| Periodical/Journal, magazine, other | 711 |
| Conference Proceedings | 3 |
| Audio book | 2 |
| Government publication | 217 |
| Thesis | 1 |
| Archived website | 4 |
| Unpublished | 3 |
| Published | 2 |
| Map | 1 |
| Sound | 1 |
| Sound/Recorded music | 1 |
As you can see, some of this is because there are multiple Article formats in use, such as Article/Report, and Article/Other article. The inclusion of non-article formats is likely due to digitised articles being grouped into works with versions that have been assigned other formats.
Formats in Trove are arranged hierarchically, with values such as Book and Article subdivided into groups like Book/Illustrated and Article/Report. This can be a bit misleading as resources can be assigned multiple formats from the same hierarchy. But by grouping formats by their top-level heading (Book, Article etc) you can display the mix of formats in each category.
Show code cell source
df_all_formats["format_group"] = df_all_formats["format"].apply(
    lambda x: x.split("/")[0]
)

df_all_format_group_totals = (
    df_all_formats.groupby(["category_name", "format_group"])["total"]
    .sum()
    .to_frame()
    .reset_index()
)

chart_category_formats = (
    alt.Chart(df_all_format_group_totals)
    .mark_bar()
    .encode(
        y=alt.Y("category_name:N").title(None).axis(grid=False),
        x=alt.X("total:Q")
        .title(None)
        .stack("normalize")
        .axis(labels=False, ticks=False, grid=False),
        color=alt.Color("format_group:N").scale(scheme="category20").title("format"),
        tooltip=[alt.Tooltip("format_group:N").title("format")],
    )
    .properties(width="container", height=300, padding=20)
    .interactive()
)

chart_category_formats
Fig. 2.4 Mix of formats in each Trove category#
This chart is interactive – scroll to zoom in and inspect the different bands; double click to reset.
The chart above offers a handy overview of the way formats are distributed across categories, but it needs some qualification. The sizes of the bars are normalised to make it easier to see the mix of formats, but this means you can’t meaningfully compare the numbers of resources across categories. In any case, because multiple formats can be associated with a single resource, the band widths really represent the number of times each format appears in resource descriptions, rather than the number of resources described. This is further complicated by grouping the formats by their top-level heading.
An alternative approach is to display how each individual format is distributed across the categories. Once again the bars are normalised so comparing counts across formats is fairly meaningless. But it does provide a useful guide to where you might expect to find particular formats in Trove.
Show code cell source
chart_formats_by_category = (
    alt.Chart(
        df_all_formats.loc[
            ~df_all_formats["category_code"].isin(["newspaper", "people"])
        ]
    )
    .mark_bar()
    .encode(
        y=alt.Y("format:N").title(None),
        x=alt.X("total:Q")
        .stack("normalize")
        .title(None)
        .axis(labels=False, ticks=False),
        color=alt.Color("category_name:N").title("category"),
        tooltip=[alt.Tooltip("category_name:N").title("category")],
    )
    .properties(width="container", padding=20)
    .interactive()
)

chart_formats_by_category
Fig. 2.5 Distribution of resource formats across Trove categories#
This chart is interactive – scroll to zoom in and inspect the different bands; double click to reset
2.7. Categories and contributors#
Each category also has a different mix of contributors, depending on the types of resources in each aggregated collection. Using the weekly harvests of Trove contributor totals in this GitHub repository you can find the number of organisations contributing records to each category.
Show code cell source
df_con = pd.read_csv(
    "https://raw.githubusercontent.com/wragge/trove-contributor-totals/main/data/trove-contributors-categories.csv"
)
df_con = df_con.loc[df_con["total"] > 0]

df_con_totals = (
    df_con.groupby("category_code")["nuc"].nunique().to_frame().reset_index()
)
df_con_totals.columns = ["category", "number of contributors"]
df_con_totals.style.hide()
| category | number of contributors |
|---|---|
| book | 969 |
| diary | 775 |
| image | 910 |
| magazine | 201 |
| music | 798 |
| research | 841 |
It’s also possible to examine how resources from different types of organisations are distributed across categories. Institutional repositories contain the research outputs of universities and other research agencies. The NUC identifiers of institutional repositories usually contain the string :IR. For example, ANU’s institutional repository has the NUC id ANU:IR. There are currently 37 organisations with :IR in their NUC ids that contribute data to Trove. Here’s the number of institutional respositories contributing resources to each category.
Show code cell source
df_irs = df_con.loc[
    (df_con["total"] > 0)
    & (df_con["nuc"].notnull())
    & (df_con["nuc"].str.contains(":IR"))
]

df_irs_nucs = df_irs.groupby("category_name")["nuc"].nunique().to_frame().reset_index()

df_irs_nucs.columns = ["category", "number of IRs"]
df_irs_nucs.style.hide()
| category | number of IRs |
|---|---|
| Books & Libraries | 37 |
| Diaries, Letters & Archives | 30 |
| Images, Maps & Artefacts | 34 |
| Music, Audio & Video | 32 |
| Research & Reports | 37 |
Here’s the number of resources contributed by institutional repositories to each category (with the usual caveats about overlaps and work groupings). Most of their content is going into Research & Reports.
Show code cell source
df_irs_total = df_irs.groupby("category_name")["total"].sum().to_frame().reset_index()

chart_con_irs = alt.Chart(df_irs_total).mark_bar().encode(
    y=alt.Y("category_name:N").title(""),
    x="total:Q",
    color=alt.Color("category_name:N").legend(None),
    tooltip=[alt.Tooltip("category_name", title="category"), "total"],
).properties(width="container", padding=20)

chart_con_irs
Fig. 2.6 Number of resources contributed by institutional repositories to each category#
How does this pattern of contributions compare to other types of organisations, such as museums? Here’s the same chart for organisations that have the word ‘Museum’ in their name.
Show code cell source
df_museums = df_con.loc[
    (df_con["total"] > 0)
    & (df_con["name"].str.contains("Museum"))
]

df_museums_total = df_museums.groupby("category_name")["total"].sum().to_frame().reset_index()

chart_con_museums = alt.Chart(df_museums_total).mark_bar().encode(
    y=alt.Y("category_name:N").title(""),
    x="total:Q",
    color=alt.Color("category_name:N").legend(None),
    tooltip=[alt.Tooltip("category_name", title="category"), "total"],
).properties(width="container", padding=20)

chart_con_museums
Fig. 2.7 Number of resources contributed by museums to each category#
You can also explore how the resources of individual organisations are distributed across Trove’s categories – just select an organisation from the dropdown list.
Show code cell source
def truncate(value, length):
    if len(value) > length:
        return f"{value[:length]}..."
    return value


contrib_nucs = list(df_con["nuc"].unique())
contrib_names = [truncate(n, 80) for n in list(df_con["name"].unique())]

dropdown = alt.binding_select(
    options=contrib_nucs, labels=contrib_names, name="Contributor: "
)
selection = alt.selection_point(fields=["nuc"], bind=dropdown, value="VPWLH")

chart_categories_contributor = (
    alt.Chart(df_con)
    .mark_bar()
    .encode(
        y=alt.Y("category_name:N").title(""),
        x="total:Q",
        color=alt.Color("category_name:N").legend(None),
        tooltip=["nuc", alt.Tooltip("category_name", title="category"), "total"],
    )
    .add_params(selection)
    .transform_filter(selection)
    .properties(width="container", padding=20)
)

chart_categories_contributor
Fig. 2.8 Number of resources by contributor and category#
Select a contributor to view how their resources are distributed by category