
16. Understanding the digitised newspapers#
Learn more about the history and characteristics of Trove’s collection of digitised newspapers and the effects this might have on your research.
16.1. The newspaper corpus is constructed#
Trove’s collection of digitised newspapers has had a major impact on research in a number of HASS disciplines, particularly history. It’s important then for researchers to think critically about the newspaper corpus, as they would with any historical source. What’s available? What’s missing? How does it change over time?
Here’s a chart that shows the number of digitised newspaper articles in Trove by year of publication.
Show code cell content
import altair as alt
import pandas as pd
import requests

params = {"category": "newspaper", "facet": "year", "encoding": "json", "n": 0}

headers = {"X-API-KEY": YOUR_API_KEY}

facets = []
for decade in range(180, 203):
    params["l-decade"] = decade
    response = requests.get(
        "https://api.trove.nla.gov.au/v3/result", params=params, headers=headers
    )
    data = response.json()
    facets += [
        {"year": t["search"], "total": t["count"]}
        for t in data["category"][0]["facets"]["facet"][0]["term"]
    ]
    facets.sort(key=itemgetter("year"))

df = pd.DataFrame(facets)

chart_totals = (
    alt.Chart(df)
    .mark_line()
    .encode(
        x="year:T",
        y=alt.Y("total:Q", title="total number of articles"),
        tooltip=[
            alt.Tooltip("year:T", format="%Y"),
            alt.Tooltip("total:Q", format=","),
        ],
    )
    .properties(width="container", padding=20)
)

display(chart_totals)
You might be wondering about the peak in 1915 – is it because of World War I? Well, yes and no. In the lead up to the centenary of WWI, it was decided to focus digitisation dollars on newspapers from the WWI period. The peak reflects decisions about funding, not the impact of historical events. And what about the dramatic collapse in the number of articles after 1954 – did the arrival of television send newspapers into a cataclysmic decline? No, it’s because of copyright. The NLA has chosen to manage some of the risks around copyright by limiting digitisation to newspaper issues published before 1955, unless there’s a special arrangement with the publisher.
The impact of these policy decisions is an important reminder that the Trove corpus is not unchanging or inevitable, it’s constructed – it’s the product of preservation decisions, funding priorities, library policies, digitisation technologies, professional practices, legal frameworks, and a fair bit of luck.
16.2. The newspaper corpus has a history#
Oddly enough, Trove is not very good at presenting its own history. While there are regular updates on newly-added titles, there’s no way of seeing when particular titles were added or the change in the number of articles over time. Earlier versions of Trove included a page of useful statistics, but this was removed in the 2020 update. To explore how Trove has changed over time, you need to piece together different data sources.
I started analysing Trove searches back in 2011, and continued at irregular intervals to create charts showing the number of articles per year in Trove. I’ve extracted the data from these charts and compiled it into a dataset available from Zenodo and GitHub. Using this data, you can visualise how Trove has changed between 2011 and 2022. For example, here’s the growth in the total number of articles
Show code cell content
import altair as alt
import arrow
import pandas as pd

dfs = []
harvests = [
    "20110412",
    "20110804",
    "20140912",
    "20151129",
    "20161214",
    "20190728",
    "20200710",
    "20210427",
    "20220121",
]
for harvest in harvests:
    csv = f"https://raw.githubusercontent.com/wragge/trove-newspaper-totals-historical/master/data/total_articles_by_year_{harvest}.csv"
    df = pd.read_csv(csv)
    date = arrow.get(harvest, "YYYYMMDD")
    df["harvested"] = date.format("YYYY-MM-DD")
    dfs.append(df)


df_all = pd.concat(dfs)
df_all["year"] = df_all["year"].astype(str)

harvest_totals = df_all.groupby("harvested")["total"].sum().to_frame().reset_index()
harvest_totals["harvested"] = pd.to_datetime(harvest_totals["harvested"])

chart_all = (
    alt.Chart(harvest_totals)
    .mark_area(point=True)
    .encode(
        x=alt.X("harvested:T", title="harvest date"),
        y=alt.Y("total:Q", title="number of articles"),
        tooltip=[alt.Tooltip("total:Q", format=","), "harvested:T"],
    )
    .properties(width="container", padding=20)
)

display(chart_all)
Fig. 16.1 Number of newspapers articles in Trove from 2011 to 2022#
Over the decade, 185,184,740 newspaper articles were added to Trove.
You can also examine how the distribution of articles by publication year changed across the same period.
Show code cell content
chart_2011_2022 = (
    alt.Chart(
        df_all.loc[
            (df_all["harvested"] == "2011-04-12")
            | (df_all["harvested"] == "2022-01-21")
        ]
    )
    .mark_line()
    .encode(
        x=alt.X("year:T", axis=alt.Axis(labelOverlap=True)),
        y=alt.Y("total:Q", title="number of articles"),
        color="harvested:N",
        order=alt.Order("harvested:N", sort="ascending"),
        tooltip=[
            alt.Tooltip("year:T", format="%Y"),
            alt.Tooltip("total:Q", format=","),
            "harvested:N",
        ],
    )
    .properties(width="container", padding=20)
)

display(chart_2011_2022)
Fig. 16.2 Number of newspapers articles in Trove by publication year, showing the change from 2011 to 2022#
The focus on WWI-era newspapers didn’t start until after 2011, but the impact was clearly evident by 2022.
It’s interesting to think about research using the newspapers that might have taken place between 2011 and 2022. How would a project started in 2011 differ to one initiated a decade later?
But it’s not just a matter of the size of the corpus, it’s also important to consider the composition. Which newspapers were added and when? While this information isn’t directly available from Trove, by harvesting data from web archive captures, I’ve managed to assemble a list of titles and the approximate date they were added.
To try and capture a more complete and up-to-date record of changes in the Trove newspaper corpus, I’ve set up an automated process to harvest data every week and display the results through the Trove Newspapers Data Dashboard. It includes information on the number of articles, distribution by state and category, and additions to newspaper titles.
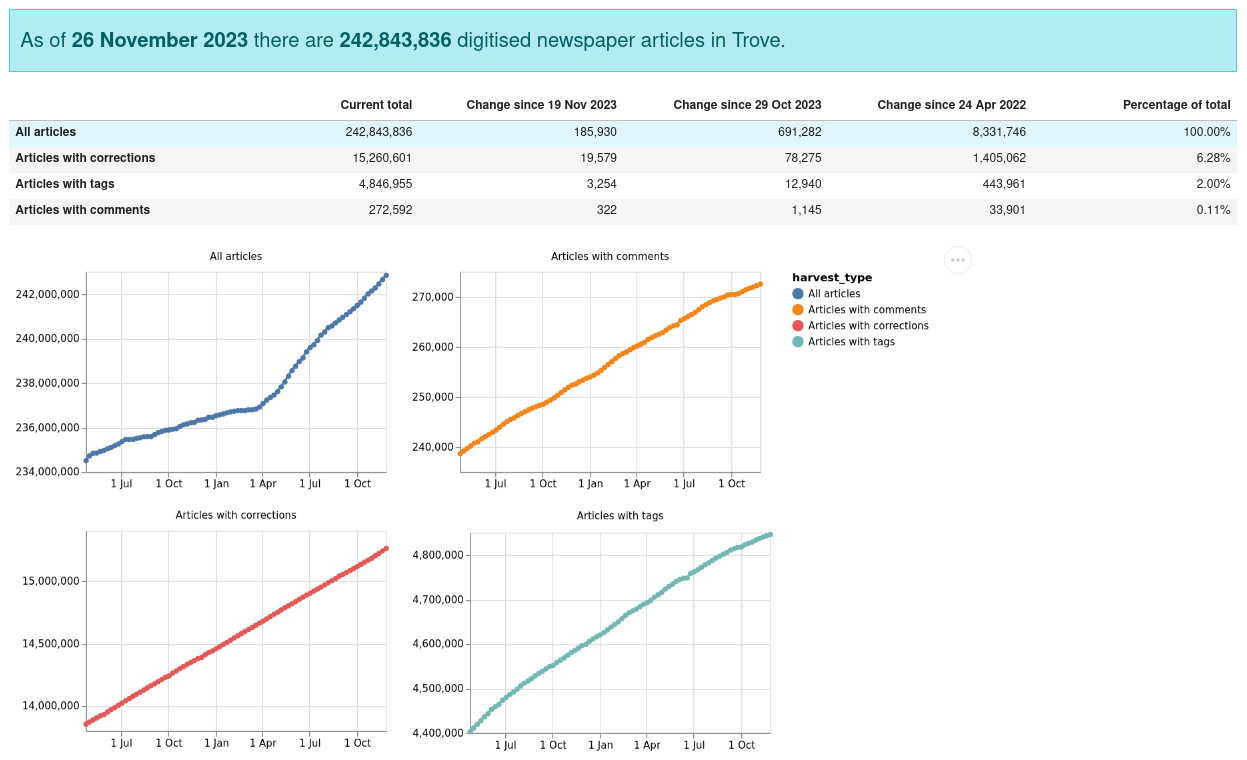
Fig. 16.3 Example of the data available from the Trove Newspaper Data Dashboard#
16.3. Where do the newspapers come from?#
Trove contains a number of different types of newspapers – as well as the familiar metropolitan dailies, there’s rural and regional newspapers from around Australia, political and religious newspapers, as well as community newspapers in a variety of languages.
Trove Places is a simple web app that lets you explore the geographic distribution of Trove’s newspapers by mapping places of publication and distribution.
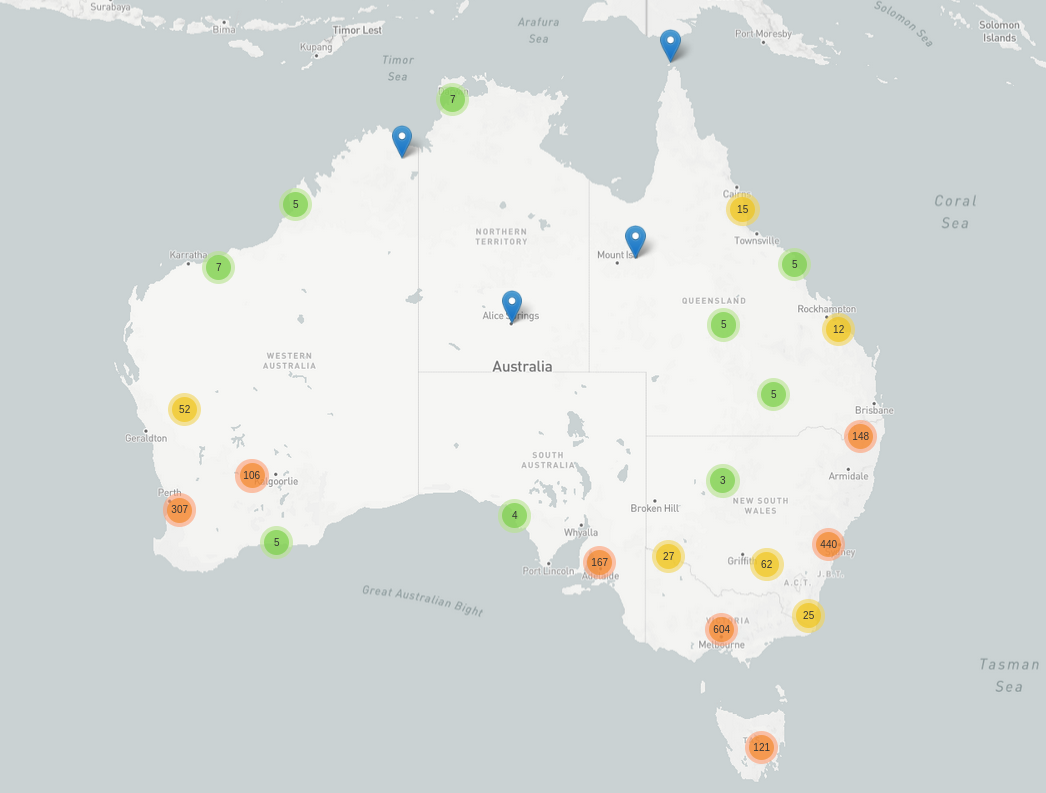
Fig. 16.4 Map from Trove Places showing the geographic distribution of Trove newspapers#
You can also use Trove’s state facet to examine the number of titles published in each ‘state’ (the list of states also includes entries for ‘National’ and ‘International’).
Show code cell content
from collections import Counter

import altair as alt
import pandas as pd
import requests

params = {"encoding": "json"}

headers = {"X-API-KEY": YOUR_API_KEY}

response = requests.get(
    "https://api.trove.nla.gov.au/v3/newspaper/titles", params=params, headers=headers
)
data = response.json()

states = []

for title in data["newspaper"]:
    states.append(title.get("state", ""))

df = pd.DataFrame(list(dict(Counter(states)).items()), columns=["state", "total"])

state_titles_chart = (
    alt.Chart(df)
    .mark_bar()
    .encode(
        x=alt.X("total:Q", title="number of titles"),
        y="state:N",
        color="state:N",
        tooltip=["state:N", alt.Tooltip("total:Q", format=",")],
    )
    .properties(width="container")
)

display(state_titles_chart)
Fig. 16.5 Number of newspaper titles published in each state#
You might not be surprised to see that Trove contains more newspapers from NSW than any other state. But again, you should be careful about assuming that these differences are the product of Australia’s publishing history, rather than more recent decisions. For example, NSW invested large amounts of money in digitisation through the State Library’s ‘Digital Excellence’ program.
Show code cell content
import altair as alt
import pandas as pd
import requests

params = {
    "category": "newspaper",
    "facet": "state",
    "l-artType": "newspaper",
    "encoding": "json",
    "n": 0,
}

headers = {"X-API-KEY": YOUR_API_KEY}

response = requests.get(
    "https://api.trove.nla.gov.au/v3/result", params=params, headers=headers
)
data = response.json()
facets = [
    {"state": t["search"], "total": t["count"]}
    for t in data["category"][0]["facets"]["facet"][0]["term"]
]

df = pd.DataFrame(facets)

state_articles_chart = (
    alt.Chart(df)
    .mark_bar()
    .encode(
        x=alt.X("total:Q", title="number of articles"),
        y="state:N",
        color="state:N",
        tooltip=["state:N", alt.Tooltip("total:Q", format=",")],
    )
    .properties(width="container")
)

display(state_articles_chart)
Another approach is to look at the number of newspaper articles published in each state.
Fig. 16.6 Number of newspaper articles published in each state#
It’s interesting that the difference in the number of articles between NSW and Victoria is much greater than the difference in number of titles. It suggests that there might be underlying differences in the type of newspapers or their publication dates. This chart also indicates that about a third of all newspaper articles in Trove were published in NSW. How might that affect your research?
16.4. What’s missing?#
It’s been estimated that around 7,700 print newspapers have been published in Australia. [Berthon and Wong, 2013] The number of titles in Trove currently stands at 1,790 – that’s a significant difference! This might again be due to digitisation funding priorities, or the fact that some short-lived newspapers just haven’t survived in any form.
The Australian Newspaper Plan (ANPlan), a collaboration between National and State Libraries, worked to identity and preserve Australian newspapers, providing the foundation for Trove. ANPlan also compiled useful lists of missing titles. (Ironically, the ANPlan website has itself disappeared, but can be found in the Australian Web Archive.)
Even when titles have been added to Trove, it’s not easy to tell if they are complete. Some newspapers published multiple editions throughout the day. Trove only includes a single edition, so it’s possible some content might be missing. A fascinating example of this is provided by Robert Phiddian, Stephanie Brookes, Lindsay Foyle and Richard Scully’s article ‘“For Gorsake, Stop Laughing: This is Serious!” — Australia’s Fragile Cartooning Archive’.[Phiddian et al., 2023] The article examines how Stan Cross’s famous ‘Stop Laughing’ cartoon, published in Smith’s Weekly, came to be missing from Trove, and explores some of the implications for research.
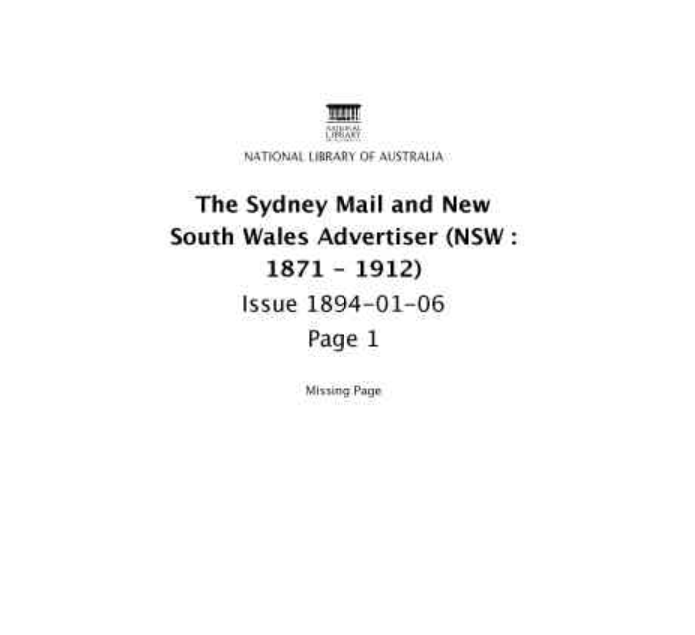
Fig. 16.7 Example of a missing page placeholder, from The Sydney Mail and New South Wales Advertiser, 6 January 1894, page 1#
Sometimes whole issues or individual pages can be missing from Trove. I’ve attempted to compile data about missing pages, but inconsistencies in pagination make it difficult to be certain whether a page is actually missing or not. Here, for example, is an issue of the The Albury Banner and Wodonga Express which seems to have multiple pages missing, but is in fact just out of order.
My rough data indicates about one in a thousand pages might be missing. What is perhaps more interesting is that these gaps are not evenly distributed. For example, the WA Record is missing about 5.5% of its pages, but most of these are pages two and three from issues published between 1897 and 1915. Intriguingly, the King Island Times is missing page five in most issues from the 1920s to the 1940s. What was on page five? There’s also significant damage to the original print copies of the Queensland Times, resulting in both missing and partial pages.
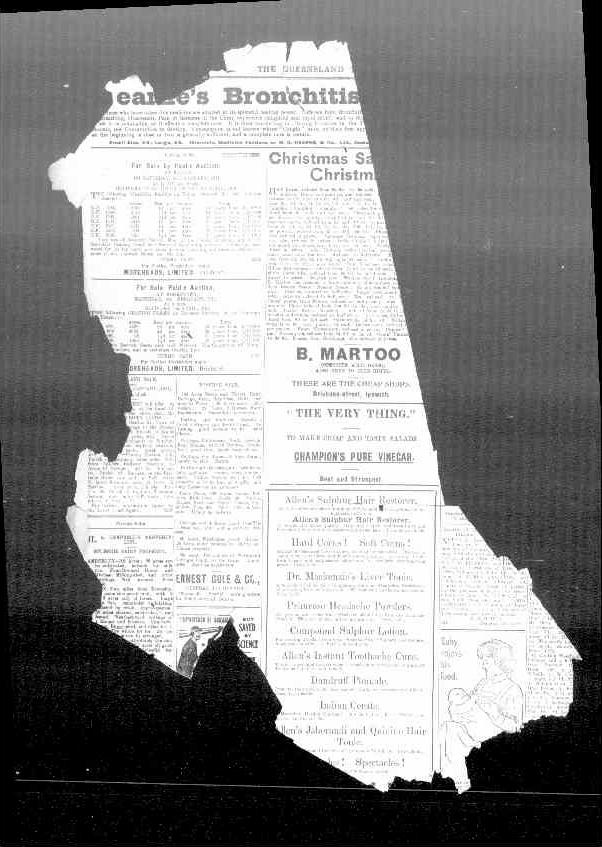
Fig. 16.8 Example of a damaged page from the Queensland Times, 2 January 1911, p. 3#
While Trove does include markers to indicate where issues and pages are missing, you can only find these by browsing. There are no measures of completeness displayed in the web interface or title metadata, and of course you can’t find missing pages by searching. While the proportion of pages missing seems small, the uneven distribution could have an impact on some research projects.
16.5. Correcting OCR errors#
Text is extracted from images of newspaper pages in Trove using Optical Character Recognition (OCR). This text is indexed to enable users to search the full content of articles. It’s so easy and familiar that you can overlook how transformative this has been. Instead of working top-down though titles and indexes, browsing through endless rolls of microfilm, researchers can use a few keywords to find thousands of fragments of everyday life.
The OCR-generated text can also be analysed at scale, using Natural Language Processing (NLP) to explore changing patterns in usage and meaning, opening up new possibilities for research.
The problem is that the OCR-generated text is rarely 100% accurate. The NLA’s early tests on Australian newspapers indicated that the OCR software’s accuracy in recognising individual characters varied between 71% and 98.02%. [Holley, 2009] High OCR error rates have an impact on both the discovery and analysis of digitised newspaper articles.
Concerns about OCR accuracy led the NLA to develop a system that allowed Trove users to correct the OCR-generated text. This has been very successful, with millions of lines of text corrected by a large community of volunteers. But it’s important to put these efforts into context.
Using the has:corrections index you can find the number of articles in Trove with corrections.
Show code cell source
import altair as alt
import pandas as pd
import requests


def get_total(params):
    headers = {"X-API-KEY": YOUR_API_KEY}
    response = requests.get(
        "https://api.trove.nla.gov.au/v3/result", params=params, headers=headers
    )
    data = response.json()
    return data["category"][0]["records"]["total"]


total_with_corrections = get_total(
    {
        "q": "has:corrections",
        "l-artType": "newspaper",
        "category": "newspaper",
        "encoding": "json",
    }
)

print(f"{total_with_corrections:,} articles have user corrections")
16,074,712 articles have user corrections
More than 15 million articles have user corrections! That’s an impressive amount, but what proportion of the total number of articles does this represent?
Show code cell source
total_articles = get_total(
    {"l-artType": "newspaper", "category": "newspaper", "encoding": "json"}
)

print(f"{total_with_corrections / total_articles:.2%} of articles have corrections")
6.43% of articles have corrections
While users have made an important contribution to the quality of the text available from the newspapers, the task is huge. More than 93% of articles have no user corrections, and thousands more articles are being added every week. This is not a job that will be completed by humans alone.
The NLA has already undertaken some trials using machine learning to correct OCR generated text. In June 2021, the Overproof system was used to improve the accuracy of 10 million uncorrected articles. This led to significant gains in search retrieval. The machine corrected texts have been added back into Trove, but don’t seem to be included in the has:corrections results. It’s also worth noting that the focus of Overproof is on improving search results, rather than correcting every word. This might have implications for projects using computational methods to analyse texts.